JavaScript Libraries for Data Visualization in AI and ML Applications
JavaScript Libraries for Data Visualization in AI and ML Applications
Artificial Intelligence (AI) and Machine Learning (ML) are among some of the most innovative and sought-after tools nowadays. AI and ML applications are taking off in various industries, from healthcare to financial services.
AI/ML apps become increasingly prevalent in the tech industry, and the importance of visualization of gathered data increased. Data visualizations allow businesses to easily monitor, interpret, and understand vast amounts of complex data quickly, which leads to making more informed decisions.
Adding visual representation into AI and ML applications enables tracking how these algorithms function in order to ensure accurate results leading to increased revenue streams long-term. Better insights can be used to create more efficient operations and re-evaluate strategies for success.
Challenges of Data Visualization in AI and ML Applications
As AI and ML conquer the world, visualization of gathered data becomes a new challenge.
Large Volume of Data
AI and ML algorithms often involve enormous amounts of processing data. Charts and diagrams in these applications are often difficult to understand and generally overwhelming.
There are a few techniques for sorting out and reducing unnecessary information that might lead to fast visualization but are not always accurate or complete. Displaying only the most relevant or the most convenient data can lead to missing valuable insights.
Therefore, we recommend using advanced visualization techniques instead of omitting variables or generalization. Interactive, multidimensional, and VR visualizations can contain all valuable information for swift understanding without excessiveness.
Nature of Data
AI and ML are improving all the time. Therefore, all the received data are constantly updating, and visualizations must do so too. Dynamic real-time data demand using interactive visualization techniques, more resources, and more elaborate update mechanisms.
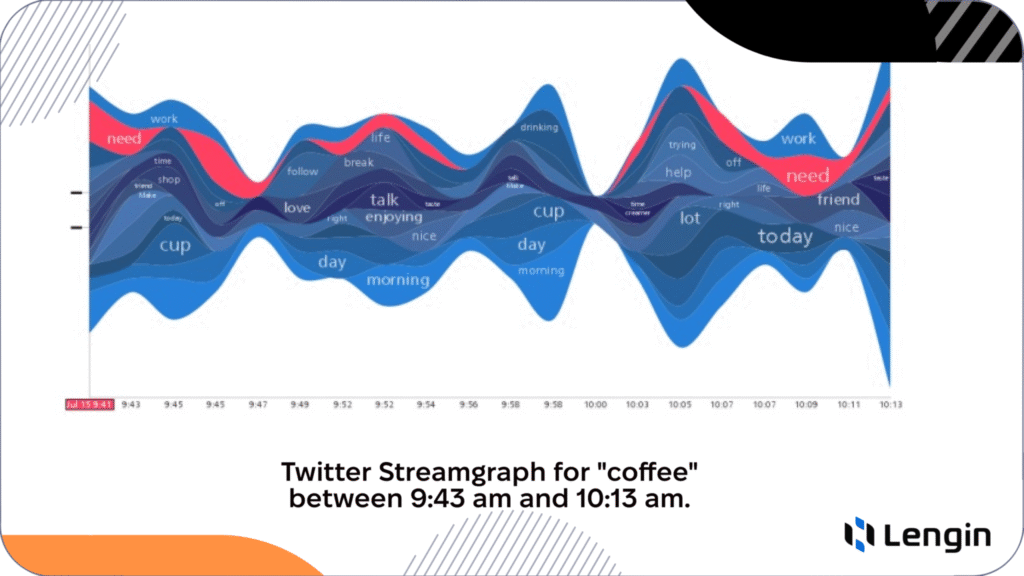
Also, AI and ML operate not only quantitative but also qualitative data that are more abstract. Abstractness is one more challenge for accurate interpretation and visualization. Descriptive analysis takes too long to get the gist, so visualization is more convenient. Streamgraphs and word clouds can depict abstract data dependencies concisely, and with JavaScript libraries, they will consume less memory but provide an understandable model for analysis.

High Dimensionality
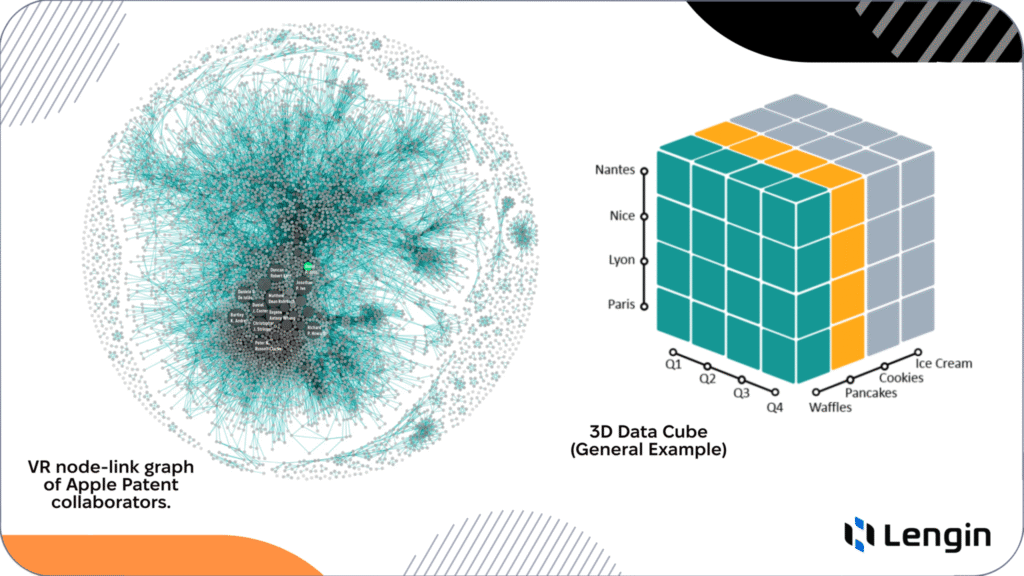
Such complex data are always tricky to depict via simple 2D graphs. That’s why dimensionality reduction techniques and a combination of visualization methods are needed. If any of those methods can’t simplify data enough for visualization via simple figures, there are 3D figures with interactive features to help.
Also, VR is beneficial for depicting high-dimensional data among novel visualization techniques. Although providing immersive and comprehensive virtual visualization is time-consuming, many JavaScript libraries can perfectly cope with this task.
Data Relationships and Dependencies
Databases can exist without bounding data with different dependencies. The more extensive database is, the more complicated relationships are. To depict those dependencies, charts, diagrams, or other chosen ways of visualization should be interconnected too. One of the best options is chord diagrams, which are widely used in StackOverflow surveys.
Also, node-link diagrams, force-directed layouts, Sankey diagrams, and parallel coordinates plots effectively depict multiple relations but have complex natures, and only some advanced libraries can handle them. The perfect example of the interactive node-link diagram is the Internet map.
JavaScript Libraries for Data Visualization in AI and ML Applications
Fortunately, the JavaScript ecosystem has many highly functional libraries for the aforementioned complex visualization techniques.
TensorFlow.js
TensorFlow.js is a JavaScript library for training and deploying machine learning models with the ability of data visualization. It can be used to build interactive demos, prototypes, and even production applications that utilize machine learning and can be run directly from the browser.
With TensorFlow.js Visualization Library, you can depict model structures with all their layers, nodes, and connections of your neural network model using both static and interactive visualizations. Also, you can plot the loss and accuracy graphs during training to monitor how your model is performing and enhance it.
D3.js and Tidy.js
As mentioned on the official D3.js website, this library can create “custom dynamic visualizations with unparalleled flexibility,” and it is the most significant advantage for dynamic data of AI and ML applications. Flexibility and reactivity allow for keeping the depiction of real-time data up-to-date.
Since this type of application is known for dealing with high complexity and layering of data, Tidy.js is a good choice for simplifying, tidying, and sorting data to make it more convenient for visualization. D3.js and Tidy.js work exceptionally well in data extraction, transformation, and clustering. They are especially suitable for large volumes of data; they can create high-performance data visualization for a wide range of applications.
The tidied data is in a standardized format that is understood by various visualization tools. Tidy.js guarantees that any changes to the tidy data will propagate automatically to visualizations, which makes it the perfect fit for a flexible D3.js library.
Chart.js
Chart.js is a JavaScript library that is devoted to drawing charts and graphs.Chart.js performs exceptionally well when handling small to medium-sized datasets because it aims to provide a simple implementation of standard chart types. Greater complexity demands using D3.js or TensorFlow.js libraries, but small AI and ML applications usually do not need sophisticated visualization, so that Chart.js will be a timesaver for such projects.
Plotly.js
Plotly.js is one more JS library that stands out with the high interactivity of created visualizations. AI and ML applications that use this library allow users to pan, zoom, and select data points with complex chart types like 3D charts, financial charts, maps, or layouts with multiple axes or subplots.
Plotly is dedicated to customization, while charting-focused libraries are more about building accurate visualizations. Also, Plotly.js strongly supports scientific and statistical visualizations, including error bars, box plots, violin plots, and statistical distributions. If your AI/ML application involves visualizing experimental or statistical data, Plotly.js can handle these scenarios effectively.
Sigma.js
Sigma.js is a perfect fit for visualizing complex relational data structures in various domains. When discussing complex data dependencies and multiple relationships between data branches, we use Sigma.js.
Sigma.js provides specialized layout algorithms for arranging graphs with filters applicable to the visualization, enabling the display of subsets of nodes and edges based on various criteria without sacrificing interactivity.
Three.js
Three.js is a popular JavaScript-based standard for creating 3D graphics in web applications. It offers robust features for creating VR data visualizations that can be viewed across multiple platforms and devices.
Three.js allows for creating high-quality animations, shading, and lighting effects visualizations on web browsers and even in Virtual Reality on VR headsets. The library provides various functionalities such as 3D object creation, modifying camera angles for better viewing, and applying lighting effects for a realistic experience.
Data gathered in AI and ML applications are so complex that typical 2D charts or diagrams can’t handle them. Interactive 3D visualizations are often overwhelming, especially those that aim to represent high-dimensional data. Three.js and Virtual Reality solve this problem.
Each library mentioned above has advantages and disadvantages, unique features, and special purposes. The wise choice of the JavaScript library for visualization of complex data in AI and ML applications will benefit in fast development, effective performance, having all necessary features, better visualization, and more accurate insights.

Business Cases
The number of AI- and ML-based applications is increasing, but only some IT teams can handle all the technical challenges. Lengin has already had the experience of working with such technologies and has delivered top solutions for our partners.
NitroHire
NitroHire is an online application with integrated AI that aims to help businesses to find their perfect employee more efficiently.
NitroHire’s integration of Chart.js aims to improve user experience by providing businesses with a simple and intuitive interface to create visually appealing charts. Visuals are easy to interpret and provide a more in-depth analysis of data, which is more compelling than raw.
The app offers to create reports on each candidate to simplify HR’s work. Those reports include visualization of qualitative and quantitative data about the candidate via appealing charts and diagrams for faster candidate screening.
Modulos Platform and Data Copilot
Modulos is an online platform for data analysis and processing. Therefore, Modulos needs data visualization features for better reporting and analytics on input data.
Data Copilot is a part of the Modulos platform. This sophisticated conversational AI assistant is specifically crafted to enhance the efficiency of your data processing, analysis, and manipulation tasks.
Both offer exceptionally accurate and customizable data visualization via interactive charts, plots, and graphs provided by implementing the D3.js library.
To find out more about our projects, you can visit our portfolio page. NitroHire, Modulos and Data Copilot are only a few examples of how beneficial using JavaScript libraries for data visualization in AI and ML applications can be.
Conclusion
Data visualization in AI/ML applications is both a challenge and an opportunity. Some JavaScript libraries carry out displaying complex information, animate data from a range of sources, or provide easy-to-read visualizations.
Lengin has already dealt with many AI- and ML-based applications, particularly data visualization. Do not hesitate to contact us if you consider leveraging your application with enhanced data visualization.