Platform that transforms complex data analysis using advanced AI
Modulos Platform
Web application for complex data analysis and processing

Overview
“We were lucky with Lengin. High-quality code, smooth communication, the employee’s dedication – we got exactly what we were looking for.”
Keven Le Moing
Tech Lead, Modulos
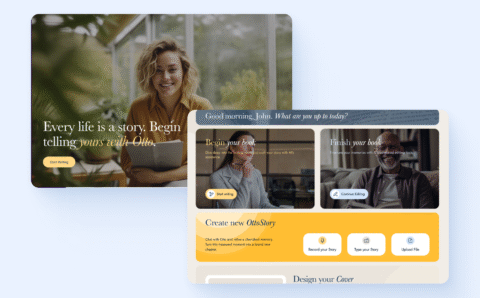
Modulos Platform is an exceptional application that revolutionizes complex data analysis and processing, taking it to unprecedented heights.
With cutting-edge AI technologies and a robust engine, this platform efficiently handles vast volumes of data, granting you invaluable insights and presenting your data in a visually captivating manner. It empowers you to delve deep into your data, enabling comprehensive study and facilitating significant enhancements.
Requirements
Our solution
Translate highly technical AI and ML workflows into a user experience accessible for data scientists, analysts, and business users without compromising depth.
Designed a step-by-step onboarding flow that turns complex dataset preparation into an intuitive survey-like process, guiding users smoothly into advanced analysis.
Ensure seamless handling of massive, multi-parameter datasets while keeping the interface responsive and intuitive.
Optimized front-end performance with Vue.js, TypeScript, and D3.js, delivering highly customizable, interactive visualizations that remained fast even under heavy loads.
Provide users with the ability to visualize complex relationships, correlations, and missing values in ways that drive actionable insights.
Implemented Data Quality Management features to automatically detect anomalies, validate integrity, and enrich datasets — shifting the focus from cleaning to insight generation.
Build trust in data quality through robust validation, cleansing, and enrichment, enabling users to rely on the platform for critical decisions.
Bridged the AI back end with a user-centric front end, ensuring the platform became not just a technical tool, but a practical decision-making assistant across diverse roles.
The Case

Our partner, Modulos, is a leading company that specializes in developing intricate AI and ML solutions. They required a team with expertise in working with complex AI back-end systems, capable of transforming data science into user-friendly and convenient interfaces.
Luckily, Lengin, as a software development company, was well-equipped to meet their requirements. Our specialists have extensive experience working with complex SaaS products and a deep understanding of intricate back-end systems.
Preface

At Lengin, we prioritize creating user-friendly interfaces for data science applications. Our developers have a culture of ensuring convenience, regardless of the complexity of the app architecture. We understand that for an app to be truly effective, it needs to provide a seamless user experience.
That’s why we focus on designing interfaces that are intuitive and user-centric. With our expertise in UX design, we create visually appealing and hassle-free interactions for data input, analysis, and more. Trust us to deliver a user-friendly app that simplifies data science workflows and enhances productivity.
How does the Platform operate?

1. Sync or upload your data onto the Modulos Platform.
2. Set the properties by selecting the data type, analysis, and goals you aim to achieve, enabling the app to provide tailored solutions.
3. Utilize the reports, insights, and graphics generated by the Modulos AI engine to delve into analysis and customized visuals of your uploaded data.
Uploading Data

Before you begin utilizing the Modulos Platform, there are a series of processes that you need to undergo after uploading your data to the app. Since the app has to handle numerous complex data indicators with various parameters, it is necessary to go through a specific introductory process before delving into studying, analyzing, and gaining insights from your data.
To streamline the pre-working phase effectively, we decided to divide it into distinct stages featuring questions and selectors that visitors must navigate step-by-step, making it look like a user-friendly survey. By providing this information and selecting customized data analysis flows, clients can obtain the most accurate and useful results.
Data Quality Management (DQM)

DQM feature analyzes uploaded datasets, identifying anomalies and data quality issues, and ensuring data integrity.
Data Cleansing: The app automatically detects and resolves common data errors, such as missing values, duplicates, and formatting inconsistencies, improving data quality.
Data Validation: DQM validates datasets against predefined rules, ensuring adherence to data formats, constraints, and business rules for reliable data.
Data Enrichment: Our app enriches datasets by appending relevant data from trusted sources, providing comprehensive insights, and enhancing data quality.
Data Quality Metrics: DQM provides users with data quality scores, completeness levels, and visualizations, enabling the assessment of dataset quality.
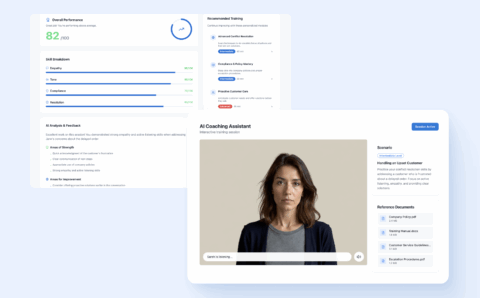
Dataset Insights

The platform offers a comprehensive suite of features designed to facilitate in-depth exploration of your datasets, equipping you with the necessary tools for thorough data analysis.
Whether you are a data scientist, analyst, or business professional, our platform empowers you to gain valuable insights and make informed decisions based on your data.
Features: Explore individual attributes with data types, unique values, and descriptive statistics.
Interactions: Uncover relationships between features through visualizations and statistical analyses.
Correlations: Visualize correlation coefficients to understand relationships between variables.
Missing Values: Identify and handle missing data, ensuring data completeness and accuracy.
Samples: Explore subsets of data for analysis, visualization, and validation.
Visualization

The Modulos Platform provides robust support for a wide range of visualization types, including bar and line charts, plots, histograms, heatmaps, and more. Developing a front-end solution for graphics visualization was a complex task, requiring meticulous attention to detail. We prioritized customization, ensuring users can fully customize the visualizations to meet their specific needs. Additionally, we incorporated zoom functionality to enable users to examine the data in greater detail.
To achieve high performance, we utilized pure JavaScript and leveraged the powerful capabilities of the D3.js library, which seamlessly integrated with our project’s technologies. This combination allowed us to deliver fast and reliable graphics generation, enhancing the overall user experience.
Results:
→ Turned a highly complex AI/ML engine into a user-friendly platform that data scientists and business users alike could navigate with confidence.
→ Enabled real-time processing and visualization of massive datasets, cutting analysis time from hours to minutes and making insights actionable faster.
→ Delivered an enterprise-grade interface that empowered Modulos to onboard new users quickly, increasing adoption and showcasing the platform’s value across industries.
What our client say

“All the time, we were feeling very safe in terms of code quality and dedication of the employee. Actually, we want to continue working with Lengin.”
Keven Le Moing
Tech Lead, Modulos